Lululemon / Supply Chain
ML SUPPLY CHAIN FOR LULULEMON
RESULT - 32% improvement in forecast accuracy and a 27% reduction in supply chain costs.
Impact
32%
Improvement in forecast accuracy
32%
Reduction in regional overstock
27%
Reduction in supply chain costs
27%
Improvement forecast accuracy
2.5x
faster time to critical action
2.5x
Acceleration in weekly allocation

Client
Lululemon
Role
Product Design Lead
Timeline
2018 - 9 months
Platform
AI Cloud Software
Client
Lululemon
Role
Product Design Lead
Timeline
2018 - 9 months
Platform
AI Cloud Software
The Problem
Opaque Forecasts & Cognitive Overload
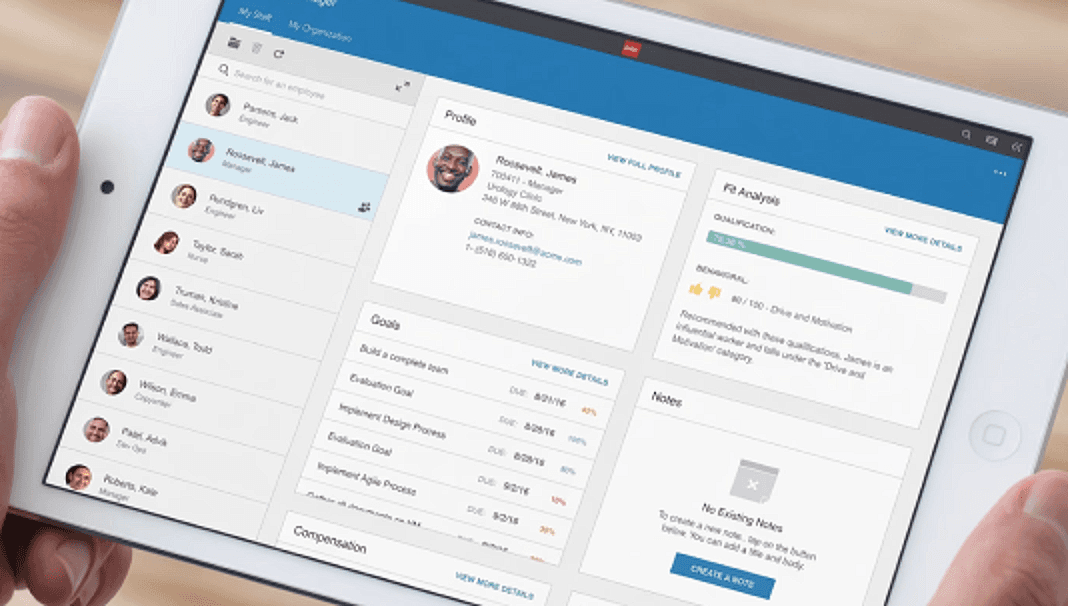
The existing workbench put a wall of data in front of fashion allocators and left them to find what mattered. Planners drilled down through layers to reach a single high alert metric, then repeated the process for the next one. In interviews they described spending most of their day documenting where a plan needed attention rather than acting on it, and asked for something that would flag problems before those problems reached the supply chain.

01 - No Summary, 02 - Weak hierarchy, 03 - Important optics below the fold
01 - No Summary, 02 - Weak hierarchy, 03 - Important optics below the fold
Research & Discovery
Understanding the problem firsthand

Field Study at Lululemon HQ
I flew to Lululemon's corporate offices to observe how fashion planners used the software day-to-day. I conducted three rounds of research, moving from broad stakeholder context to granular user behavior:
1
Business Stakeholder Interviews
2
User Interviews with fashion planners
3
Contextual Inquiry: Watching planners work inside the live system
Responses & Feedback
"
"
"It takes too long to identify where my plan needs attention."
"It takes too long to identify where my plan needs attention."
"It takes too long to identify where my plan needs attention."
"
"
"I don't want to drill down from a product to see how it's performing."
"I don't want to drill down from a product to see how it's performing."
"I don't want to drill down from a product to see how it's performing."
"
"
"I need an alert that tells me about problems before they halt my supply chain."
"I need an alert that tells me about problems before they halt my supply chain."
Design Thinking Workshop
Once field data was collected, I conducted an OOUX exercise to orient objects to actions, mapping user pain points directly to interface behaviors.
This exercise helped align design, engineering, and business stakeholders around six shared design principles that would govern every decision moving forward.
▤
▤
Summarize at the right level
Summarize at the right level
↑
Show the impact
◈
◈
Suggest actions via ML
Suggest actions via ML
◉
◉
Personalization per role
Personalization per role
→
Guide users' next steps
⊞
⊞
Establish threshold criteria
Establish threshold criteria
The workshop identified
that planners needed to see alerts in a single, scannable view. We iterated on two competing approaches, a comprehensive long grid and a prioritized short grid, and put them to the test."

Variant testing
Lo-fidelity wireframes THEN A/B TESTING
7 equal-weight alert cards. Critical items share visual space with info-level notifications, scanning requires reading every card.
Severity-ranked list. CRITICAL surfaces immediately at top; INFO recedes to bottom. Count badges replace the icon + large-numeral column format.
7 equal-weight alert cards. Critical items share visual space with info-level notifications — scanning requires reading every card.
Severity-ranked list. CRITICAL surfaces immediately at top; INFO recedes to bottom. Count badges replace the icon + large-numeral column format.
7 equal-weight alert cards. Critical items share visual space with info-level notifications — scanning requires reading every card.
Severity-ranked list. CRITICAL surfaces immediately at top; INFO recedes to bottom. Count badges replace the icon + large-numeral column format.
TEST RESULTS · 3 WEEKS, 16 PLANNERS
Time to critical action
A
2.6s
B
6.4s
Alert acknowledge rate
Alert rate
A
82%
B
64%
Task completion rate
A
89%
B
67%
Manager satisfaction
A
4.6 / 5
B
2.9 / 5

DECISION
Variant A - 7 equal-weight cards was adopted as the standard alert component.
WINNER
A
KEY LEARNINGS
01
Seeing all seven categories at once beat ranking them. Planners scanned the grid faster than a list.
02
02
Explicit severity labels (CRITICAL / WARNING / INFO) and tabular count badges scanned faster than icons under time pressure.
Explicit severity labels and tabular count badges scanned faster than icons under time pressure.
03
The card grid won on every metric, and the ranked list's labeling and badges were folded into what shipped.
Final Design
The model flags the miss. The planner picks the move.


Key takeaways & enterprise learnings
WHAT machine learning taught me
Trust requires
Trust requires
transparency. Showing the why behind machine learning recommendations is the single most effective way to drive system adoption in high-stakes environments.
Enterprise operators
Enterprise operators
prefer information-dense interfaces over minimalist whitespace, provided visual hierarchy and typography guide the scan path.
"The hardest part wasn't building the model, it was building the trust that let planners believe in it."
"The hardest part wasn't building the model, it was building the trust that let planners believe in it."
32%
Reduction in regional overstock
27%
Improvement forecast accuracy
2.5x
Acceleration in weekly allocation
EXPLORE MORE

Lululemon / Supply Chain
ML SUPPLY CHAIN FOR LULULEMON
RESULT - 32% improvement in forecast accuracy and a 27% reduction in supply chain costs.
Impact
32%
Improvement in forecast accuracy
32%
Reduction in regional overstock
27%
Reduction in supply chain costs
27%
Improvement forecast accuracy
2.5x
faster time to critical action
2.5x
Acceleration in weekly allocation
Client
Lululemon
Role
Product Design Lead
Timeline
2018 - 9 months
Platform
AI Cloud Software
Client
Lululemon
Role
Product Design Lead
Timeline
2018 - 9 months
Platform
AI Cloud Software
The Problem
Opaque Forecasts & Cognitive Overload
The existing workbench put a wall of data in front of fashion allocators and left them to find what mattered. Planners drilled down through layers to reach a single high alert metric, then repeated the process for the next one. In interviews they described spending most of their day documenting where a plan needed attention rather than acting on it, and asked for something that would flag problems before those problems reached the supply chain.
01 - No Summary, 02 - Weak hierarchy, 03 - Important optics below the fold
01 - No Summary, 02 - Weak hierarchy, 03 - Important optics below the fold
Research & Discovery
Understanding the problem firsthand
Field Study at Lululemon HQ
I flew to Lululemon's corporate offices to observe how fashion planners used the software day-to-day. I conducted three rounds of research, moving from broad stakeholder context to granular user behavior:
1
Business Stakeholder Interviews
2
User Interviews with fashion planners
3
Contextual Inquiry: Watching planners work inside the live system
Responses & Feedback
"
"
"It takes too long to identify where my plan needs attention."
"It takes too long to identify where my plan needs attention."
"It takes too long to identify where my plan needs attention."
"
"
"I don't want to drill down from a product to see how it's performing."
"I don't want to drill down from a product to see how it's performing."
"I don't want to drill down from a product to see how it's performing."
"
"
"I need an alert that tells me about problems before they halt my supply chain."
"I need an alert that tells me about problems before they halt my supply chain."
Design Thinking Workshop
Once field data was collected, I conducted an OOUX exercise to orient objects to actions, mapping user pain points directly to interface behaviors.
This exercise helped align design, engineering, and business stakeholders around six shared design principles that would govern every decision moving forward.
▤
▤
Summarize at the right level
Summarize at the right level
↑
Show the impact
◈
◈
Suggest actions via ML
Suggest actions via ML
◉
◉
Personalization per role
Personalization per role
→
Guide users' next steps
⊞
⊞
Establish threshold criteria
Establish threshold criteria
The workshop identified
that planners needed to see alerts in a single, scannable view. We iterated on two competing approaches, a comprehensive long grid and a prioritized short grid, and put them to the test."
Variant testing
Lo-fidelity wireframes THEN A/B TESTING
7 equal-weight alert cards. Critical items share visual space with info-level notifications, scanning requires reading every card.
Severity-ranked list. CRITICAL surfaces immediately at top; INFO recedes to bottom. Count badges replace the icon + large-numeral column format.
7 equal-weight alert cards. Critical items share visual space with info-level notifications — scanning requires reading every card.
Severity-ranked list. CRITICAL surfaces immediately at top; INFO recedes to bottom. Count badges replace the icon + large-numeral column format.
7 equal-weight alert cards. Critical items share visual space with info-level notifications — scanning requires reading every card.
Severity-ranked list. CRITICAL surfaces immediately at top; INFO recedes to bottom. Count badges replace the icon + large-numeral column format.
TEST RESULTS · 3 WEEKS, 16 PLANNERS
Time to critical action
A
2.6s
B
6.4s
Alert acknowledge rate
Alert rate
A
82%
B
64%
Task completion rate
A
89%
B
67%
Manager satisfaction
A
4.6 / 5
B
2.9 / 5
DECISION
Variant A - 7 equal-weight cards was adopted as the standard alert component.
WINNER
A
KEY LEARNINGS
01
Seeing all seven categories at once beat ranking them. Planners scanned the grid faster than a list.
02
02
Explicit severity labels (CRITICAL / WARNING / INFO) and tabular count badges scanned faster than icons under time pressure.
Explicit severity labels and tabular count badges scanned faster than icons under time pressure.
03
The card grid won on every metric, and the ranked list's labeling and badges were folded into what shipped.
Final Design
The model flags the miss. The planner picks the move.
Key takeaways & enterprise learnings
WHAT machine learning taught me
Trust requires
Trust requires
transparency. Showing the why behind machine learning recommendations is the single most effective way to drive system adoption in high-stakes environments.
Enterprise operators
Enterprise operators
prefer information-dense interfaces over minimalist whitespace, provided visual hierarchy and typography guide the scan path.
"The hardest part wasn't building the model, it was building the trust that let planners believe in it."
"The hardest part wasn't building the model, it was building the trust that let planners believe in it."
32%
Reduction in regional overstock
27%
Improvement forecast accuracy
2.5x
Acceleration in weekly allocation
EXPLORE MORE
Lululemon / Supply Chain
ML SUPPLY CHAIN FOR LULULEMON
RESULT - 32% improvement in forecast accuracy and a 27% reduction in supply chain costs.
Impact
32%
Improvement in forecast accuracy
32%
Reduction in regional overstock
27%
Reduction in supply chain costs
27%
Improvement forecast accuracy
2.5x
faster time to critical action
2.5x
Acceleration in weekly allocation
Client
Lululemon
Role
Product Design Lead
Timeline
2018 - 9 months
Platform
AI Cloud Software
Client
Lululemon
Role
Product Design Lead
Timeline
2018 - 9 months
Platform
AI Cloud Software
The Problem
Opaque Forecasts & Cognitive Overload
The existing workbench put a wall of data in front of fashion allocators and left them to find what mattered. Planners drilled down through layers to reach a single high alert metric, then repeated the process for the next one. In interviews they described spending most of their day documenting where a plan needed attention rather than acting on it, and asked for something that would flag problems before those problems reached the supply chain.
01 - No Summary, 02 - Weak hierarchy, 03 - Important optics below the fold
01 - No Summary, 02 - Weak hierarchy, 03 - Important optics below the fold
Research & Discovery
Understanding the problem firsthand
Field Study at Lululemon HQ
I flew to Lululemon's corporate offices to observe how fashion planners used the software day-to-day. I conducted three rounds of research, moving from broad stakeholder context to granular user behavior:
1
Business Stakeholder Interviews
2
User Interviews with fashion planners
3
Contextual Inquiry: Watching planners work inside the live system
Responses & Feedback
"
"
"It takes too long to identify where my plan needs attention."
"It takes too long to identify where my plan needs attention."
"It takes too long to identify where my plan needs attention."
"
"
"I don't want to drill down from a product to see how it's performing."
"I don't want to drill down from a product to see how it's performing."
"I don't want to drill down from a product to see how it's performing."
"
"
"I need an alert that tells me about problems before they halt my supply chain."
"I need an alert that tells me about problems before they halt my supply chain."
Design Thinking Workshop
Once field data was collected, I conducted an OOUX exercise to orient objects to actions, mapping user pain points directly to interface behaviors.
This exercise helped align design, engineering, and business stakeholders around six shared design principles that would govern every decision moving forward.
▤
▤
Summarize at the right level
Summarize at the right level
↑
Show the impact
◈
◈
Suggest actions via ML
Suggest actions via ML
◉
◉
Personalization per role
Personalization per role
→
Guide users' next steps
⊞
⊞
Establish threshold criteria
Establish threshold criteria
The workshop identified
that planners needed to see alerts in a single, scannable view. We iterated on two competing approaches, a comprehensive long grid and a prioritized short grid, and put them to the test."
Variant testing
Lo-fidelity wireframes THEN A/B TESTING
7 equal-weight alert cards. Critical items share visual space with info-level notifications, scanning requires reading every card.
Severity-ranked list. CRITICAL surfaces immediately at top; INFO recedes to bottom. Count badges replace the icon + large-numeral column format.
7 equal-weight alert cards. Critical items share visual space with info-level notifications — scanning requires reading every card.
Severity-ranked list. CRITICAL surfaces immediately at top; INFO recedes to bottom. Count badges replace the icon + large-numeral column format.
7 equal-weight alert cards. Critical items share visual space with info-level notifications — scanning requires reading every card.
Severity-ranked list. CRITICAL surfaces immediately at top; INFO recedes to bottom. Count badges replace the icon + large-numeral column format.
TEST RESULTS · 3 WEEKS, 16 PLANNERS
Time to critical action
A
2.6s
B
6.4s
Alert acknowledge rate
Alert rate
A
82%
B
64%
Task completion rate
A
89%
B
67%
Manager satisfaction
A
4.6 / 5
B
2.9 / 5
DECISION
Variant A - 7 equal-weight cards was adopted as the standard alert component.
WINNER
A
KEY LEARNINGS
01
Seeing all seven categories at once beat ranking them. Planners scanned the grid faster than a list.
02
02
Explicit severity labels (CRITICAL / WARNING / INFO) and tabular count badges scanned faster than icons under time pressure.
Explicit severity labels and tabular count badges scanned faster than icons under time pressure.
03
The card grid won on every metric, and the ranked list's labeling and badges were folded into what shipped.
Final Design
The model flags the miss. The planner picks the move.
Key takeaways & enterprise learnings
WHAT machine learning taught me
Trust requires
Trust requires
transparency. Showing the why behind machine learning recommendations is the single most effective way to drive system adoption in high-stakes environments.
Enterprise operators
Enterprise operators
prefer information-dense interfaces over minimalist whitespace, provided visual hierarchy and typography guide the scan path.
"The hardest part wasn't building the model, it was building the trust that let planners believe in it."
"The hardest part wasn't building the model, it was building the trust that let planners believe in it."
32%
Reduction in regional overstock
27%
Improvement forecast accuracy
2.5x
Acceleration in weekly allocation